Control D: A Year In Data 2025
Discover DNS trends and insights derived from Control D data for 2025. You’ll see global spikes in traffic, popular services, and what's in store for 2026.


What a year of DNS can tell you about the internet
DNS sits underneath everything. Every app you open, every website you visit, every device that checks in with the mothership: it usually starts with a question like “where do I find this domain?”
That makes DNS a surprisingly good instrument for understanding the shape of internet activity at a high level. This year-in-review is exactly that: trends and insights drawn from aggregated Control D data across 2025. You’ll see big-picture DNS volume and rhythms, how encrypted DNS usage shifted over the year, and what security filters actually end up blocking in practice.
We’re not here to tell stories about individual users or organizations. We’re interested in the forest, not the trees. The numbers and examples throughout are privacy-preserving, opt-in where applicable, and aggregated so they describe the internet’s weather, not anyone’s browsing.
Let’s zoom out and look at what 2025 looked like from the DNS layer.
How we did this: methods, data sources, and privacy
This report is built from three main data sources inside Control D. They each answer a different kind of question, and they each come with different tradeoffs around completeness, cost, and what’s even possible to measure.
2.1 Data sources at a glance
Analytics is our most queryable dataset. It’s where we pull high-level aggregates like total DNS volume over time, top queried domains, protocol usage (legacy vs DoH/DoT/DoQ), geography (source and destination), and block actions (blocked vs bypassed vs redirected). Analytics data is opt-in, and field availability varies depending on time range and region.
Dragonfly is our “deep inspection” pipeline. Instead of starting from users, it starts from domains. We take a selected list of domains (for example, the top N most queried) and collect richer signals on demand: WHOIS, GeoIP, TLS details, basic HTTP behavior, screenshots, and limited crawl or network request information. This is how we can talk about things like “how modern is the web’s TLS posture” or “how often popular domains depend on third-party services,” without needing to look at any individual customer’s traffic.
Core API and account metadata show us, in aggregate, how Control D is being set up: common Profile counts, connected Endpoints, and which Filters and Services are generally enabled. It’s a useful counterweight to traffic analytics because it reflects product usage trends rather than domain popularity.

2.2 Privacy, opt-in, and what we don’t do
Where analytics data is used, it is based on opt-in telemetry and presented in aggregate. Where domain-level inspection is used (Dragonfly), it is collected from domains directly, on a curated subset, and used to characterize broad trends across the popular web, not to profile customers. And where configuration data is used (Core API / Accounts), it’s summarized into distributions and adoption rates.
3. DNS security and safety: what got blocked in 2025
For this section we’re focusing on four security-oriented blocklists:
- Malware
- Phishing
- Newly registered domains (NRD)
- Cryptominers
3.1 How to read the numbers
Each row below shows:
- Share of total traffic (%): what % of all DNS queries match domains in that category
- Current block rate (%): of those category-matching queries, what % are currently blocked
- Currently blocked share (%): how much of all traffic is blocked by that category today (share × block rate)
- Potential increase (pp): if everyone enabled that category, how much the overall block rate would rise, in percentage points
- Blocked queries: total blocked query count attributed to that category in the dataset
One caveat: categories can overlap (a domain can be both “NRD” and “malware”), so you shouldn’t add these categories together and expect perfect arithmetic.
3.2 Security blocklists: share, block rate, and headroom (by analytics region)
| Region | Blocklist | Share of total traffic | Current block rate | Currently blocked share | Potential increase if enabled for all | Blocked queries |
|---|---|---|---|---|---|---|
| Europe | malware | 0.0471% | 81.5% | 0.0383% | +0.00872 pp | 47,229,316 |
| Europe | phishing | 0.000960% | 57.2% | 0.000550% | +0.000411 pp | 676,998 |
| Europe | nrd | 0.0171% | 15.0% | 0.00257% | +0.0146 pp | 3,169,826 |
| Europe | cryptominers | 0.0546% | 65.7% | 0.0358% | +0.0187 pp | 44,122,907 |
| America | malware | 0.0558% | 85.6% | 0.0478% | +0.00806 pp | 44,274,669 |
| America | phishing | 0.00187% | 18.2% | 0.000341% | +0.00153 pp | 316,258 |
| America | nrd | 0.0299% | 12.3% | 0.00369% | +0.0263 pp | 3,416,388 |
| America | cryptominers | 0.0686% | 74.1% | 0.0508% | +0.0178 pp | 47,106,338 |
| Asia | malware | 0.0852% | 94.2% | 0.0803% | +0.00491 pp | 25,525,819 |
| Asia | phishing | 0.000772% | 73.6% | 0.000568% | +0.000204 pp | 180,744 |
| Asia | nrd | 0.00223% | 59.6% | 0.00133% | +0.000902 pp | 423,156 |
| Asia | cryptominers | 0.184% | 87.1% | 0.160% | +0.0238 pp | 51,015,600 |
3.3 What stands out
- These categories are small slices of total DNS traffic, but because total volume is huge they still represent tens of millions of blocked queries.
- Malware has consistently high block rates across regions, especially Asia (~94%).
- Cryptominers is the standout in Asia: about 0.184% of total traffic matches the category, and most of it is blocked (~87%).
- NRD shows the most “headroom” in America and Europe regions (potential increases of +0.0263 pp and +0.0146 pp), meaning more of that category’s traffic is currently passing through simply because not everyone enables it.
4. The year in DNS: daily rhythms and peak moments
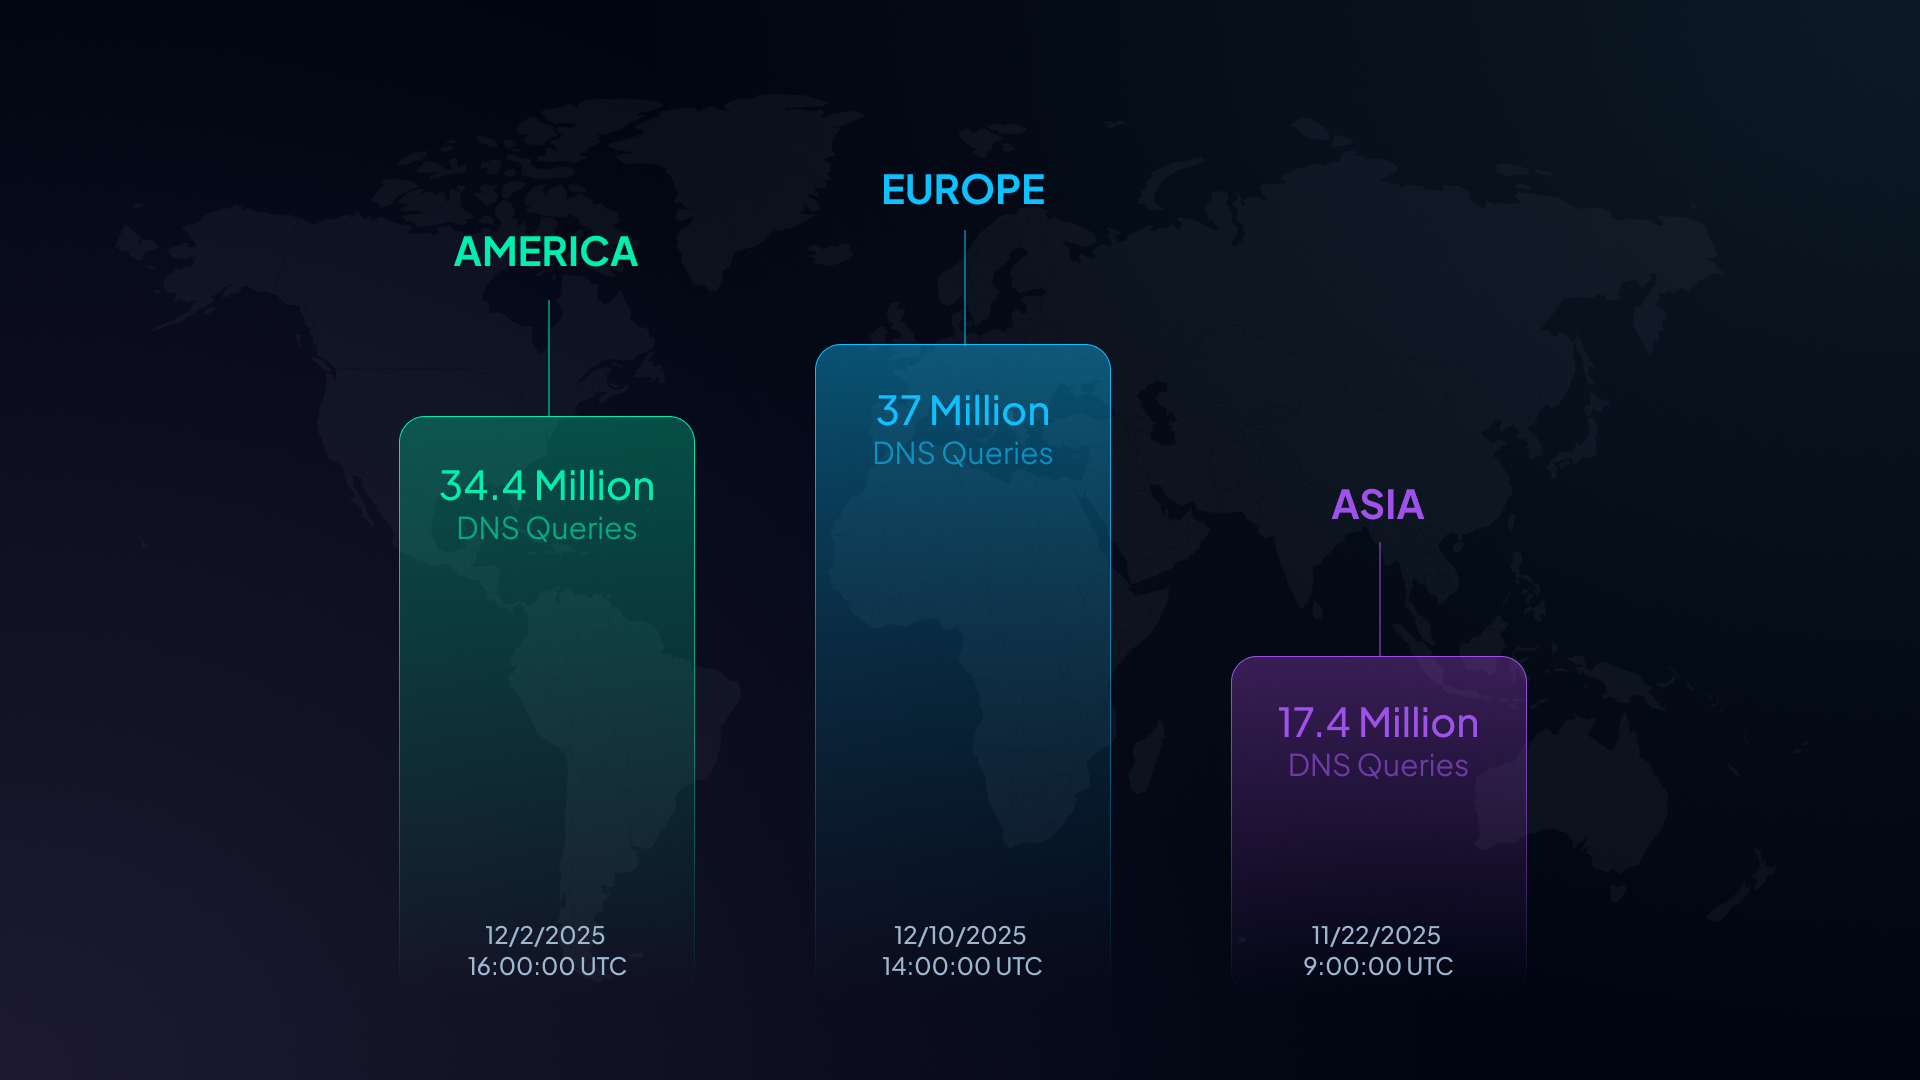
4.1 Internet rush hour: the biggest single-hour spikes
Even in a system built for steady throughput, there are a few hours that stand out as traffic stampedes. Below are the busiest hours we observed in the last month in each Analytics region.
Times are shown in UTC. Local times in parentheses are approximate for the region.
- Europe: December 10, 2025 at 14:00 UTC (15:00 CET): 36.96M DNS queries in one hour
- America: December 2, 2025 at 16:00 UTC (11:00 EST): 34.40M DNS queries in one hour
- Asia: November 22, 2025 at 09:00 UTC (17:00 SGT): 17.40M DNS queries in one hour
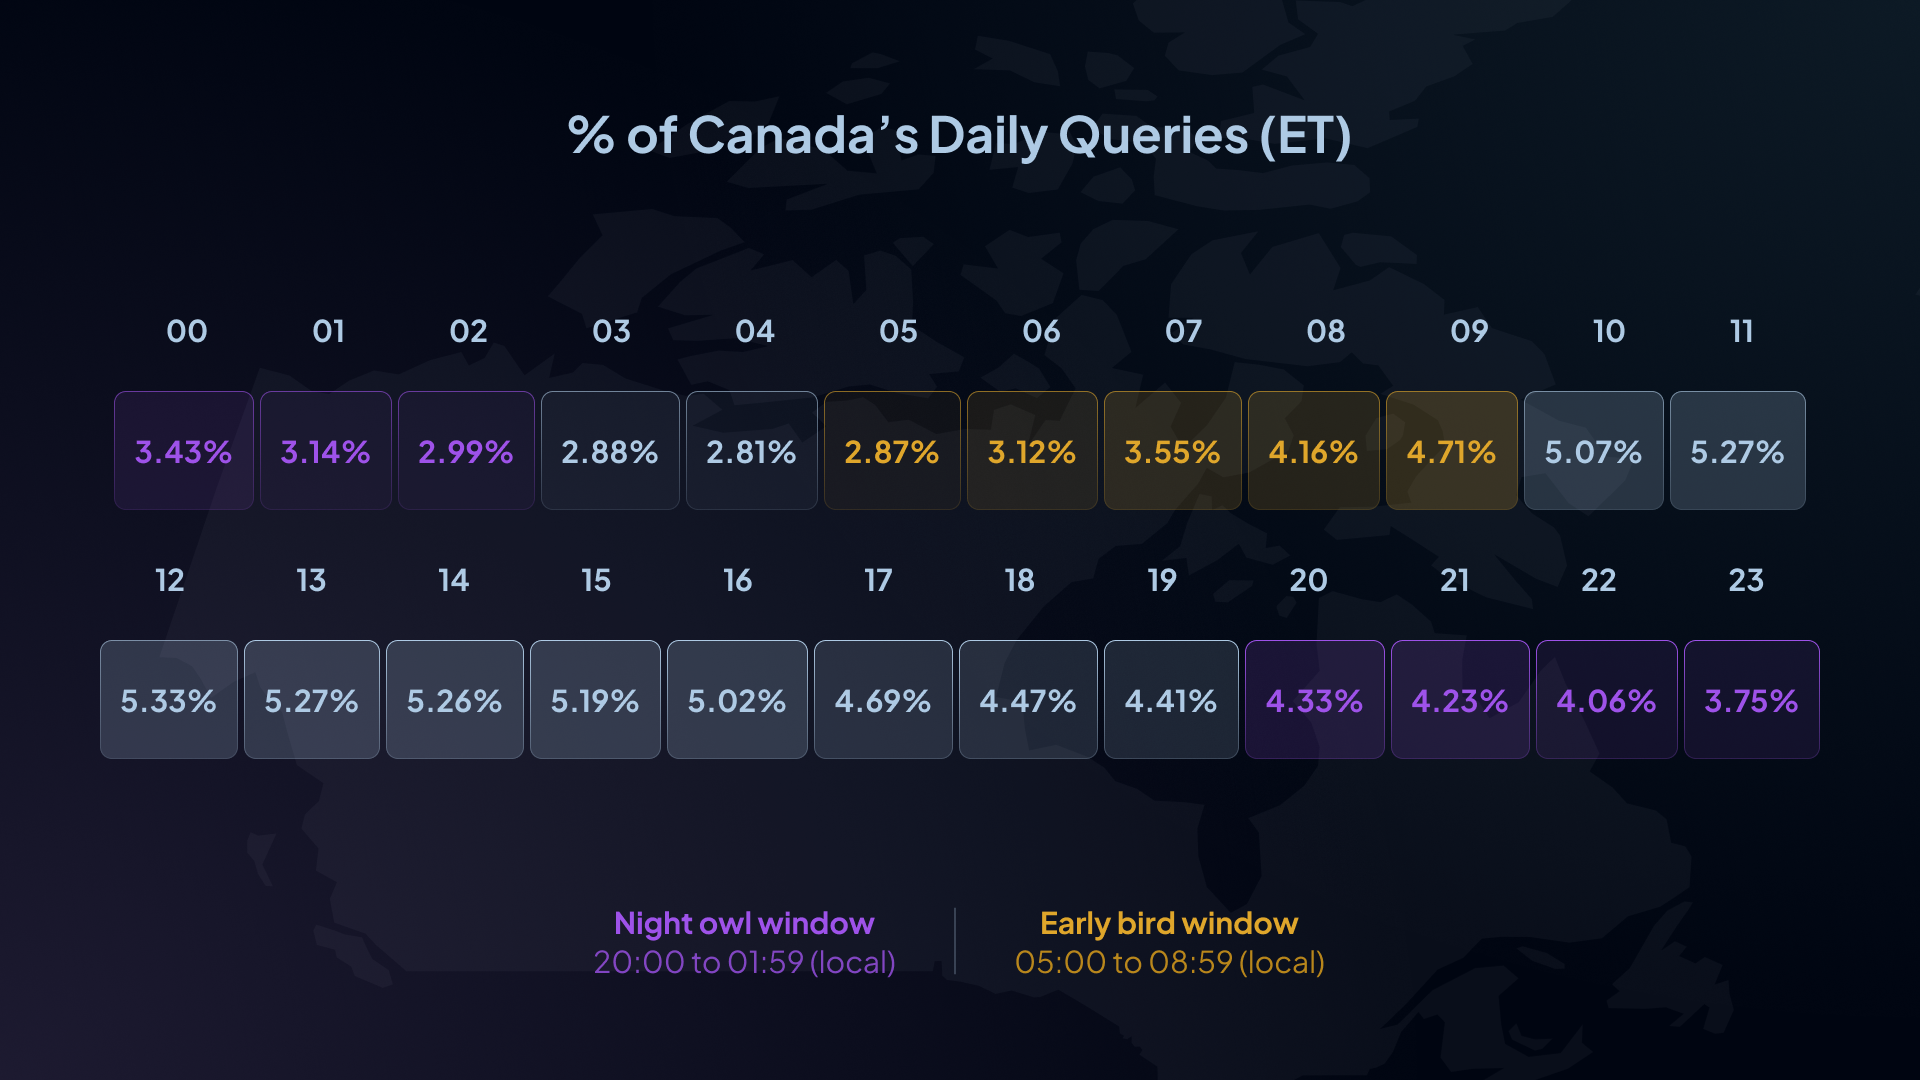
4.2 Night owls vs early birds
When we talk about daily rhythms, we’re really talking about how traffic distributes across the 24-hour day. The catch: the raw hourly buckets here are in UTC, so “8pm” only means something once you translate it into a rough local time.
To make comparisons more intuitive, we apply a representative UTC offset per country and look at two windows:
- Night owl window: 20:00 to 01:59 (local)
- Early bird window: 05:00 to 08:59 (local)
A few examples (local time is approximate, especially for countries with multiple time zones or daylight savings shifts):
- Canada (approx UTC-5 representative): 22.9% of daily queries land in the night-owl window; 13.7% land in the early-bird window.
- Germany (UTC+1): ~23.0% of daily queries land in the night-owl window; ~14.2% land in the early-bird window.
- Japan (UTC+9): ~20.3% of daily queries land in the night-owl window; ~10.8% land in the early-bird window.
- United Kingdom (UTC+0): ~21.1% night-owl; ~14.9% early-bird.
- United States (approx UTC-5 representative): ~22.5% night-owl; ~14.2% early-bird.
5. How people use Control D: profiles, endpoints, and what gets enabled
This section focuses on configured usage: accounts with at least one profile and accounts with at least one endpoint. The goal is to describe how Control D is used once it’s actively set up.
5.1 Profiles and endpoints: configuration distribution
Profiles per account (among accounts with ≥ 1 profile)
- Consumers: 64.4% have 1 profile, 16.7% have 2, 7.5% have 3, and 11.4% have 4+.
- Distribution checkpoints: 90% have 4 or fewer profiles, 95% have 5 or fewer, and 99% have 10 or fewer.
- Organizations: 73.8% have 1 profile, 14.1% have 2, 6.1% have 3, and 6.0% have 4+.
- Distribution checkpoints: 90% have 3 or fewer profiles, 95% have 4 or fewer, and 99% have 8 or fewer.
Endpoints per account (among accounts with ≥ 1 endpoint)
- Consumers: 48.0% have 1 endpoint, 16.4% have 2, 9.5% have 3, and 26.1% have 4+.
- Distribution checkpoints: 50% have 2 or more endpoints, 90% have 7 or fewer, and 99% have 18 or fewer.
- Organizations: 54.7% have 1 endpoint, 16.9% have 2, 7.2% have 3, and 21.2% have 4+.
- Distribution checkpoints: 90% have 8 or fewer endpoints, 95% have 15 or fewer, and 99% have 101 or fewer.
A little note here - it's not as unusual as you might think for an Organization to have a small number of endpoints. Because of the ability to set up Control D using ctrld, our lightweight daemon, directly on a router, many Organization devices are clients of endpoints, of which there could be hundreds or thousands.
5.2 Most commonly enabled blocklists and services
To avoid over-indexing on “accounts” (which can have multiple profiles), we include both:
- Account-level adoption: What share of configured accounts enable this at least once?
- Profile-level adoption: What share of all profiles have this enabled?
Most enabled blocklists
| Blocklist | % of configured consumer accounts | % of configured org accounts | % of all profiles |
|---|---|---|---|
| ads | 62.7% | 40.9% | 54.3% |
| malware | 61.4% | 48.0% | 53.8% |
| ip_malware | 52.6% | 35.3% | 42.6% |
| phishing | 41.5% | 48.8% | 39.5% |
| fakenews | 31.2% | 28.1% | 27.7% |
| nrd | 22.8% | 34.3% | 20.1% |
| cryptominers | 22.7% | 23.6% | 18.7% |
Most commonly configured services (any action)
In Control D, a “service enabled” means it’s configured with one of these actions on at least one profile:
- Block
- Bypass
- Redirect (IP)
- Redirect (location)
| Service | % of configured consumer accounts | % of configured org accounts | % of all profiles |
|---|---|---|---|
| xbox | 25.7% | 5.4% | 17.2% |
| steam | 25.0% | 5.4% | 16.4% |
| twitch | 24.2% | 5.4% | 15.8% |
| ea | 23.9% | 5.0% | 15.6% |
| roblox | 23.4% | 5.2% | 15.3% |
| fortnite | 23.4% | 5.0% | 15.2% |
What people actually do with services (profile-level actions)
This breakdown is shown as a share of profiles where the service is configured, since an account can use different actions across different profiles.
| Service | Block | Bypass | Redirect (IP) | Redirect (location) |
|---|---|---|---|---|
| Xbox | 23.3% | 64.2% | 12.2% | 0.2% |
| Steam | 24.0% | 69.2% | 6.7% | 0.2% |
| Twitch | 27.2% | 67.7% | 4.9% | 0.2% |
| EA | 26.1% | 68.8% | 4.9% | 0.2% |
| Roblox | 28.8% | 68.8% | 2.2% | 0.2% |
| Fortnite | 28.3% | 69.0% | 2.4% | 0.2% |
Overall, blocklist adoption tends to be driven by broad safety and hygiene categories (ads, malware, IP malware). Services skew more heavily toward consumer use cases in the top ranks, and are most often configured as allowlists (explicitly allowing specific apps or platforms) rather than blocks.
6. The modern web under the hood: HTTPS posture and third-party dependencies
This section uses Dragonfly “on-demand” probes across a Top 90th percentile by traffic domain set. That list intentionally includes a lot of non-website infrastructure (push endpoints, reverse DNS, NTP pools, malformed domains, and other service-only hosts), so the results below should be read as internet infrastructure as seen through DNS, not “the top websites list”.
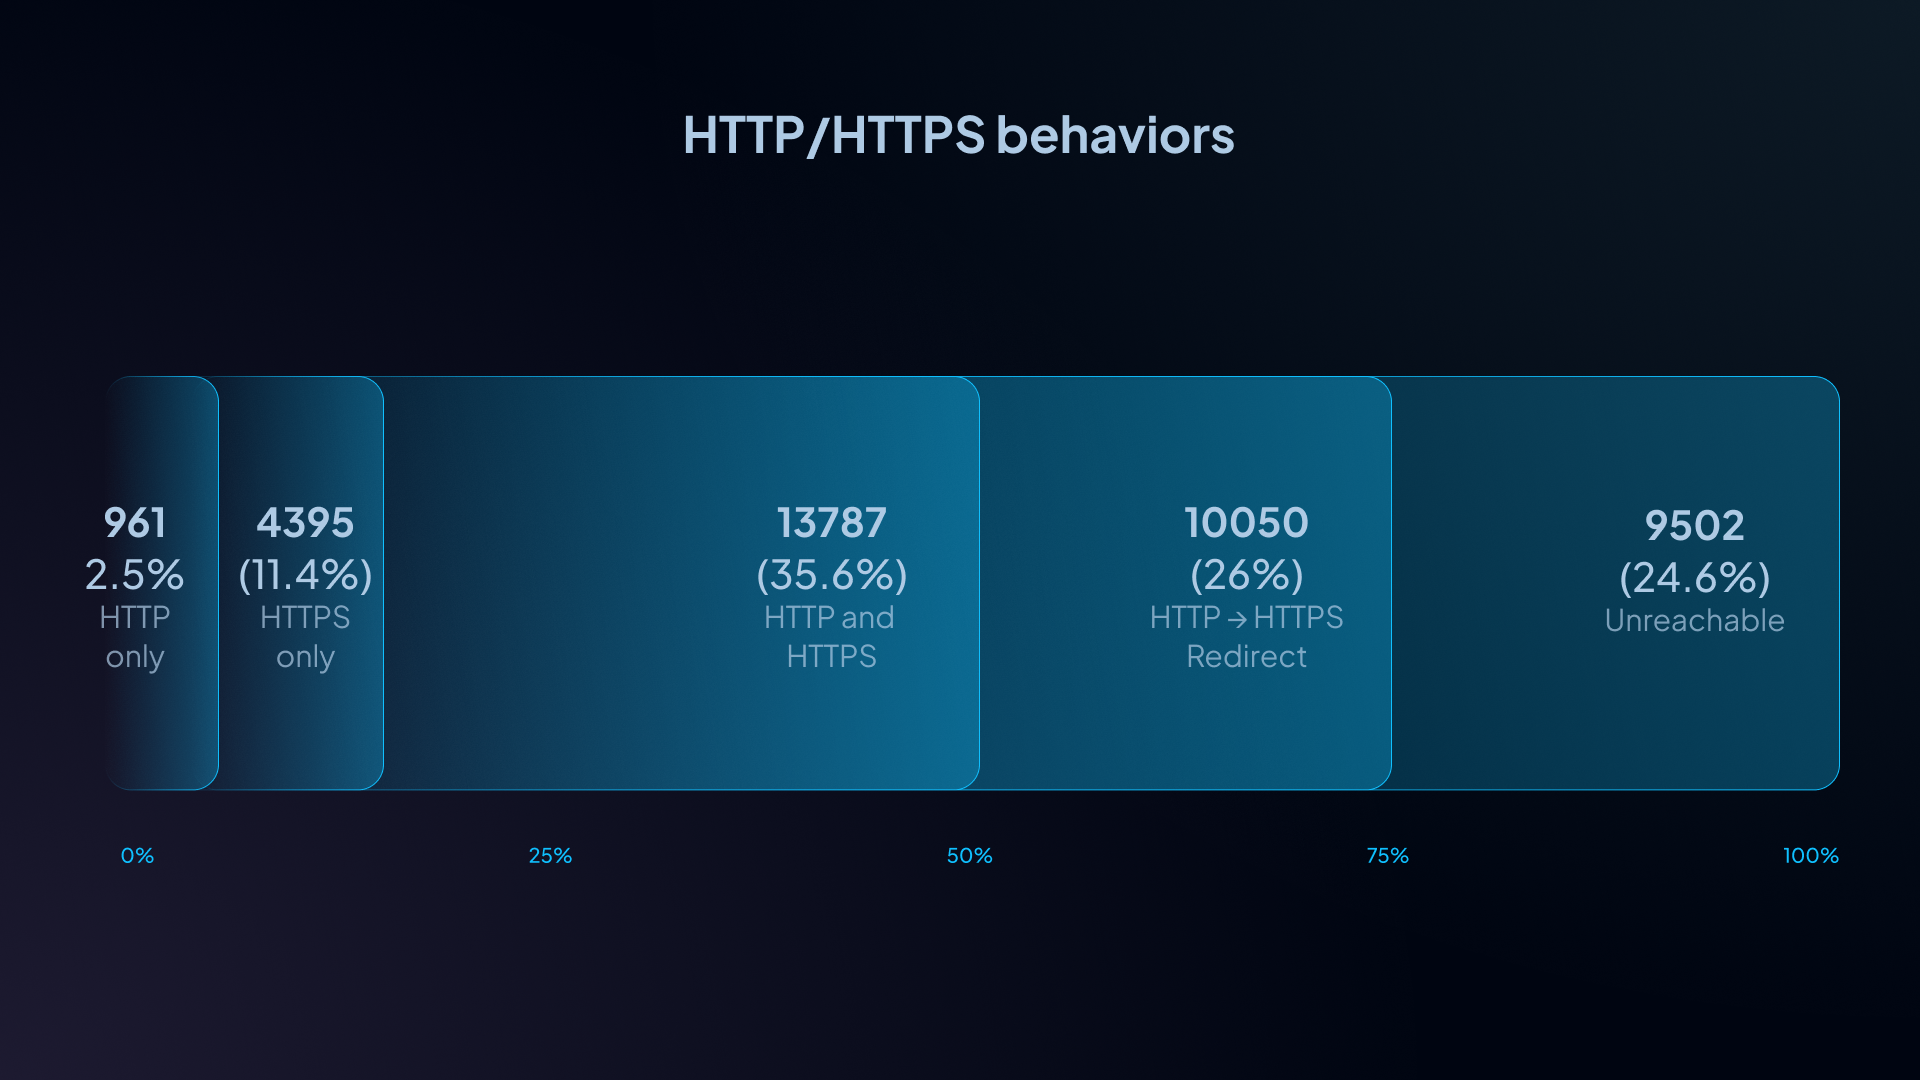
6.1 HTTP vs HTTPS: how often does the web insist on encryption?
Across the input set (38,695 domains):
- 24.6% were unreachable for this probe (no usable HTTP/HTTPS result).
- 75.4% were reachable and produced a complete result.
Across all domains in the input set:
- 26.0% redirect HTTP → HTTPS
- 11.4% are HTTPS-only (HTTP not accessible)
- 35.6% serve both HTTP and HTTPS (no redirect)
- 2.5% are HTTP-only
Combined: 37.3% of domains either redirect to HTTPS or are HTTPS-only.
If you look only at reachable domains, about 49.5% either redirect to HTTPS or are HTTPS-only, and HTTP-only drops to ~3.3%.
What does this mean for browsing? HTTPS is clearly the default posture for popular domains (either enforced or preferred about half the time when reachable), and truly HTTP-only sites are now a small minority. The big “gotcha” in practice is less “the web is stuck on HTTP” and more “a non-trivial chunk of domains just don’t reliably answer this kind of probing at all” (the 24.6% unreachable bucket).
6.2 Server headers: what’s fronting these domains?
Where server headers were present, the most common reported server types included:
- nginx: 12.3%
- cloudflare: 9.9%
- akamaighost: 4.8%
- amazons3: 3.8%
- cloudfront: 3.6%
- Other: 26.0%
This is not a complete “market share” view (headers can be absent, masked, or normalized), but it’s a useful indicator of how heavily modern traffic leans on CDNs, reverse proxies, and managed edges.
6.3 Third-party dependencies: how often do domains load the wider web?
NetLog looks at network requests made on a domain’s home page and captures third-party dependencies when present. Because our Top 90th-by-traffic list includes many non-web domains, it’s important to separate “has a page with third-party deps” from “is simply a high-traffic domain”.
Summary from our research:
- Total sites: 39,044
- Sites with third-party dependencies: 4,307 (11.0%)
- Sites with no third-party dependencies: 34,737 (89.0%)
The “no dependency” group is largely infrastructure and non-website domains (reverse DNS, NTP pools, push notification servers, malformed domains, and other non-HTTP services). For dependency insights, we therefore focus on the subset that has at least one third-party dependency.
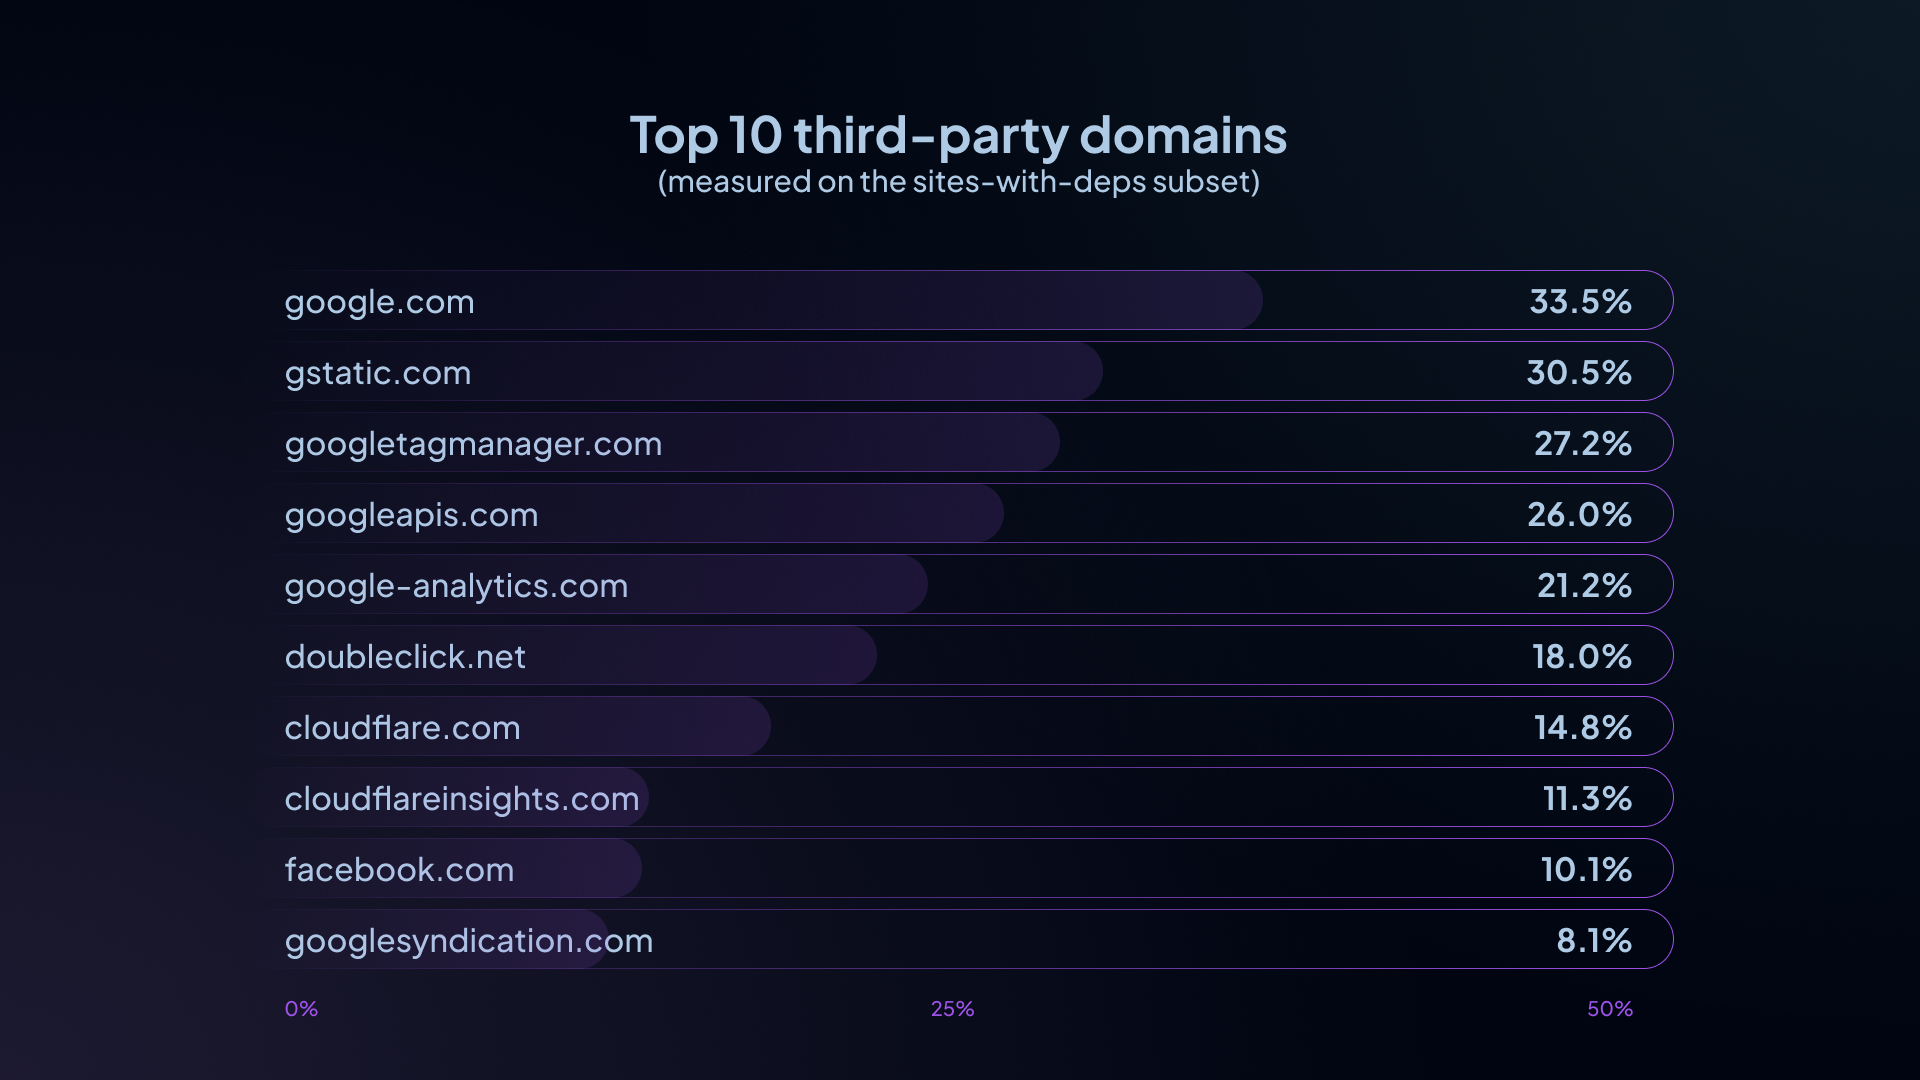
Among sites with third-party dependencies, the most common third-party domains are heavily concentrated in a few major ecosystems (percentages below are “% of sites-with-deps that include this third-party domain”):
- google.com (33.5%)
- gstatic.com (30.5%)
- googletagmanager.com (27.2%)
- googleapis.com (26.0%)
- google-analytics.com (21.2%)
- doubleclick.net (18.0%)
- cloudflare.com (14.8%)
- cloudflareinsights.com (11.3%)
- facebook.com (10.1%)
- googlesyndication.com (8.1%)
7. Nerd corner
A few technical “deep cuts” here - where noted, these views are based on partial-year data.
7.1 Encryption trends (last 3 months only)
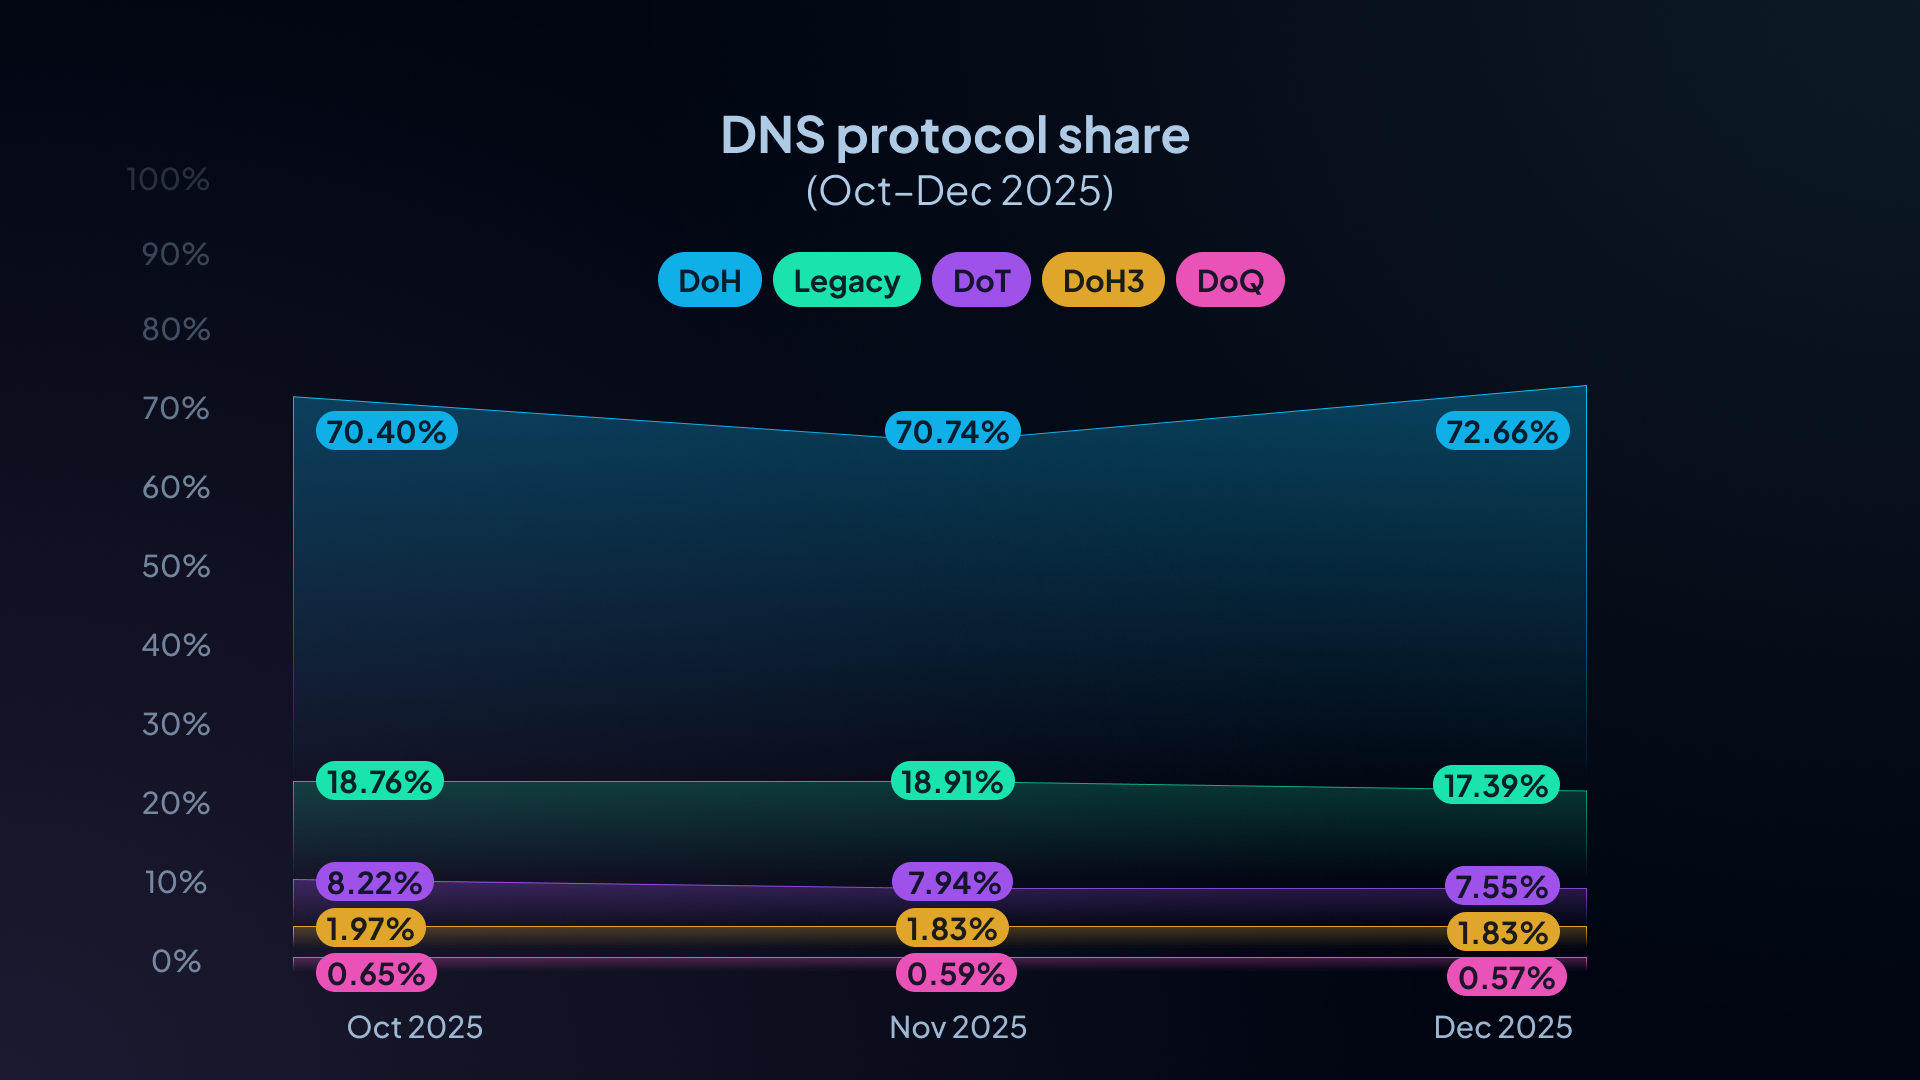
We currently have protocol breakdowns for October–December 2025. Within that window:
- Encrypted DNS (DoH/DoH3/DoT/DoQ) made up 81–83% of traffic overall:
- Oct 2025: 81.24%
- Nov 2025: 81.09%
- Dec 2025: 82.61%
- DoH dominates as the primary encrypted protocol:
- Oct: 70.40%
- Nov: 70.74%
- Dec: 72.66%
- Legacy DNS fell from 18.76% (Oct) to 17.39% (Dec), a 1.37 percentage-point drop over the 3-month window.
7.2 IPv6: how often are we seeing AAAA?
This is a simple proxy for IPv6 “in the real world”: among DNS queries for A and AAAA records, what share are AAAA?
Overall (all sources combined, including rows where source country is unknown):
- AAAA share: ~36.0% of A/AAAA queries
By analytics region:
- Europe: ~37.3%
- America: ~36.4%
- Asia: ~31.2%
A few country examples (AAAA share of A/AAAA queries):
- Finland: ~49.6%
- Germany: ~47.7%
- Japan: ~47.3%
- United States: ~33.7%
- Canada: ~29.0%
- Philippines: ~10.3%
7.3 Internet insomnia: who is busiest after midnight?
Using our records of hourly distribution of DNS traffic, we can approximate how much traffic occurs after midnight local time by applying representative timezone offsets to UTC hour buckets.
Measured as % of a country’s daily queries occurring between 00:00 and 05:59 local time (representative local time):
- Canada (ET, UTC-5): ~18.1%
- United States (ET, UTC-5): ~19.2%
- United Kingdom (UTC+0): ~18.1%
- Japan (UTC+9): ~16.5%
- Germany (UTC+1): ~12.7%
Caveat: multi-timezone countries (Canada/US) are shown using a representative ET conversion.
8. What this means for 2026 and beyond
We don't have a lone dramatic reveal for you. Instead, we offer consistent signals of the Internet and how we're using it.
The first signal is scale. Even when security categories represent a small fraction of total traffic, the absolute numbers are large. Across regions we see tens of millions of blocked requests tied to malware and cryptominer infrastructure. NRD is the most nuanced of the set: it can be a strong early-warning layer, but it also demands careful tuning and clear UX, because “new” is not the same as “malicious.”
The second signal is encryption becoming routine. In the protocol trend window we have today, encrypted DNS accounts for the overwhelming majority of measured traffic, and DoH remains the dominant transport. Our next step here is to extend coverage so we can report longer-term trends with confidence, not just a snapshot.
The biggest investment, though, is domain intelligence. Today, some of our most interesting insights require a “what was blocked” lens, because uncategorized allowed traffic is essentially invisible at the category level. Expanding Dragonfly’s domain classification so that every domain Control D sees can be classified changes that. It turns DNS from a stream of isolated questions into a structured dataset where we can answer higher-order questions safely and at scale: what kinds of domains are most common, how categories shift by region and time, what would change if you enabled a given protection, and how the threat landscape evolves in near real time.
That’s also why the boundary between “websites” and “internet plumbing” matters. High-traffic DNS includes a lot of infrastructure domains that don’t behave like human-facing pages. Better classification lets us separate those worlds cleanly, and makes any downstream measurement (HTTP/TLS posture, third-party dependencies, hosting concentration) more accurate and interpretable.
If you like working on systems where scale and correctness matter, and where privacy constraints are part of the design rather than a bolt-on, DNS is a great place to be. Come work with us at Control D.