Control D Feature Release: Analytics 2.0
Discover Control D's Analytics 2.0 – a complete rebuild delivering 15x faster insights, 1-month log retention, real-time DNS visibility, and more.

This has been in the works for a very, very long time, but we’re proud to announce that Analytics 2.0 is finally here!
This isn't an incremental update. It's a ground-up rebuild designed to give you faster answers, deeper context, and the data retention you've been asking for.
Let’s dive into what’s new.
What's New: The 3 Headline Features
1. One-Month Query Log Retention
One of the most highly requested features in Analytics 2.0 is extended query log retention. Previously, logs were kept for 3 days, but we’ve heard your feedback loud and clear: you now have access to 1 month of query log data.
This provides you with a full month of historical data to track trends, investigate patterns, and troubleshoot issues that may have otherwise been missed due to the previous shorter retention window.
It’s all about giving you greater visibility and control over your data, making it easier to monitor and optimize your network over an extended period.
2. Complete UI Redesign with Unified Refinement
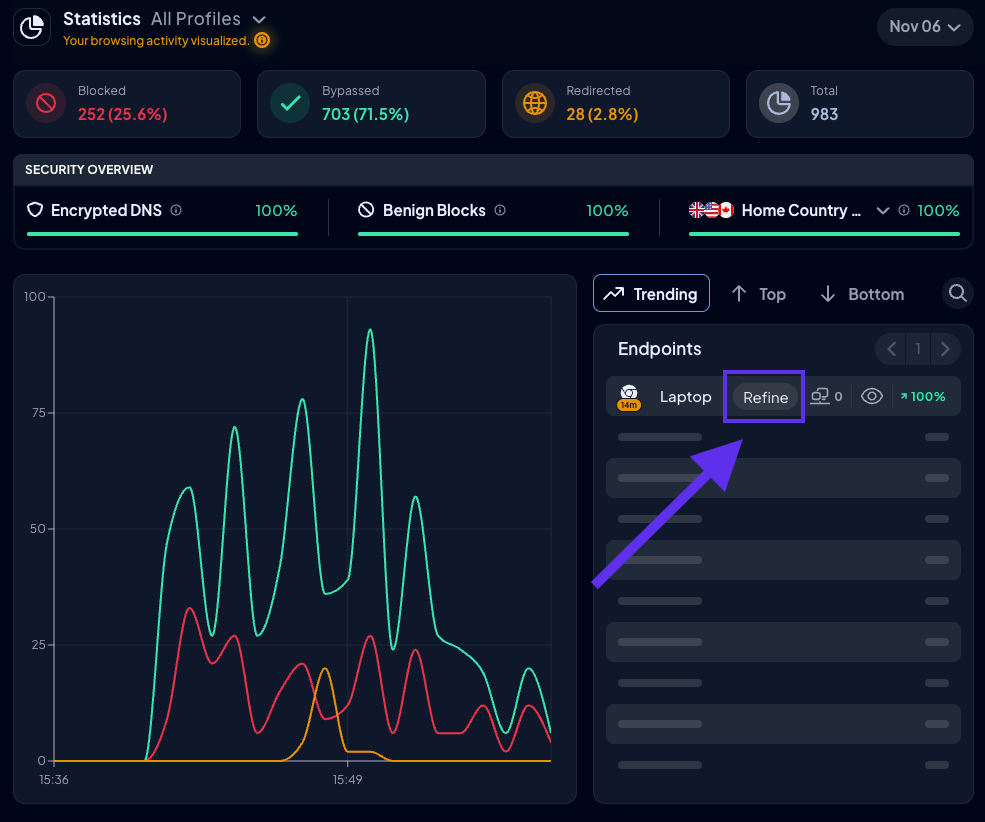
The entire Statistics interface has been rebuilt around a unified refinement system. Instead of navigating between disconnected views, you now refine data in place by hovering over any element – Endpoints, Filters, Services, domains, countries, ASNs, and anything else you see on your screen – and clicking "Refine."

Every refinement appears as a pill at the top of the page. Refinements stack with AND logic, and removing a pill is as easy as one click.
More importantly, every chart, metric, and list updates together instantly and scopes to that context – you move from overview to root cause without having to change views.
3. Performance Boost: Analytics 2.0 is Faster Than Ever
We didn't just redesign the interface; we rebuilt the entire Analytics engine from scratch, and the performance difference is massive. Analytics 2.0 runs on a completely new data pipeline optimized for speed and scale.
In our internal testing, we’ve seen up to 98% reduction in query times, with performance improvements across the board of 1,474% faster query processing – that’s almost a 15x increase in speed.
We tested across a variety of organization sizes and query volumes, and for your typical daily and weekly views, you can expect sub-second response times. And that speed compounds.
When every interaction is instantaneous, investigation workflows that used to take minutes now take seconds. You stay in flow, and you find answers before you lose your train of thought.
Before we dive into example workflows and see Analytics 2.0 in action, let’s take a closer look at some of the other key upgrades and improvements.
What Else is New in Analytics 2.0?
1. Security Overview Health Bars

These health bars give you an instant read on your network's security posture. All three metrics should trend toward 100%:
- Encrypted DNS = share of queries over DoH/DoT/DoQ
- Benign Blocks = blocks from non-security Filters
- Home Country Traffic = queries from your designated home countries
Configure up to three home countries via the dropdown, and the interface shows flags next to the metric.
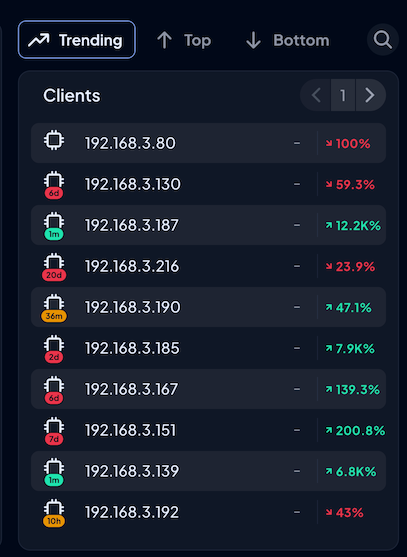
2. Endpoints and Clients with Trend Comparisons
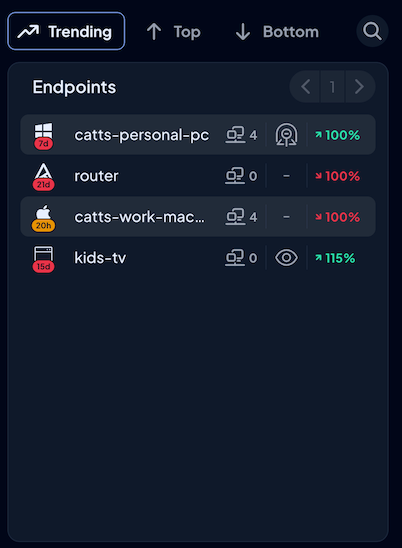
The Endpoints overview ranks your devices by query volume and shows each one's blocked queries compared to its typical baseline. When an Endpoint shows significantly more blocks than normal, you know something changed.
Refine by that Endpoint to reveal the Clients view with the same intelligence: which Clients are driving activity, their share of traffic, and their blocked-versus-typical metrics.
Each row also surfaces the most active Filter for quick context.
3. Geographic and Network Visibility
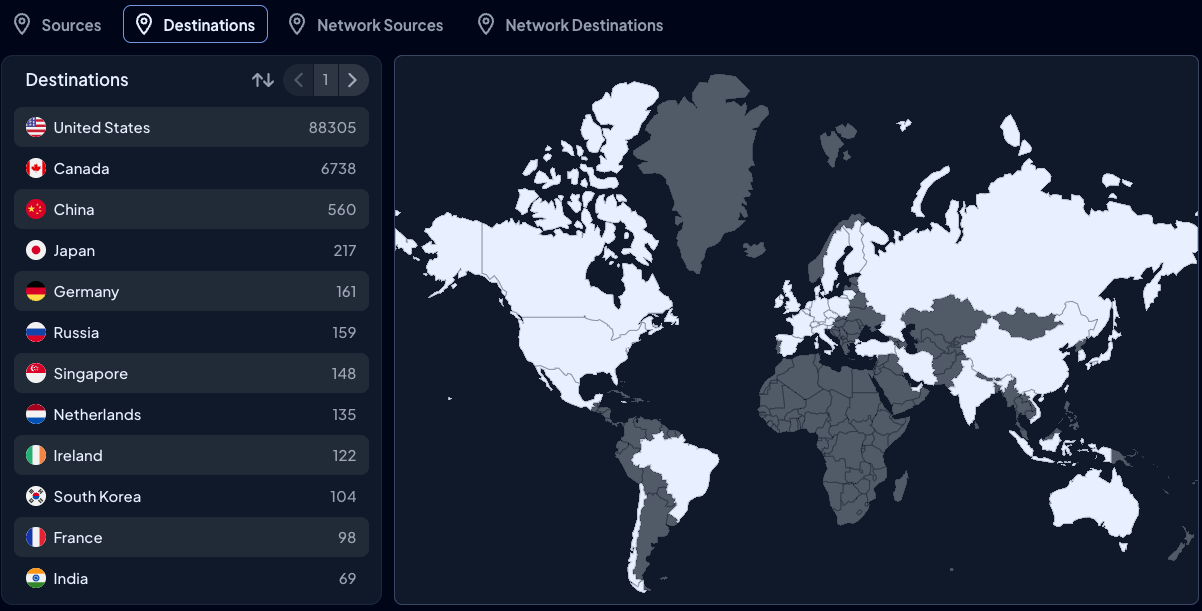
The map view shows traffic origins and destinations by country and by ASN. Top 10 lists sit beside an interactive world map where countries with traffic appear in white. Click any country to refine instantly.
Switch to the Network Sources or Network Destinations tabs to view the top ASNs, which is ideal for spotting unexpected providers or tracking down rogue traffic sources.
4. Top Actions Breakdown
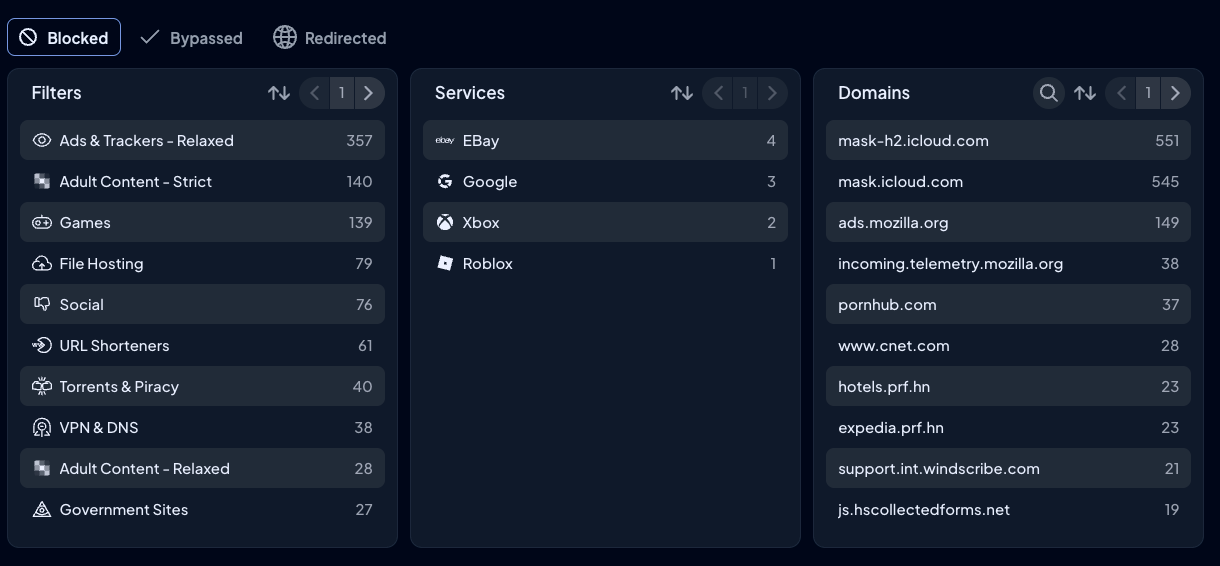
Toggle between Blocked, Bypassed, and Redirected tabs to understand what's driving each outcome. In Blocked, you see top Filters, Services, and domains.
In Bypassed and Redirected, you see the Services and domains involved. As always, hover over any item to refine it, even the domain.
5. Profile Scoping

Select "All Profiles" or a single Profile from the top bar to scope every chart and metric. When you select a single Profile, the view only shows queries that the Profile enforced.
Something to keep in mind is that if an Endpoint enforces multiple Profiles, you'll only see the subset of that Endpoint's queries that this specific Profile handled, not all queries from that Endpoint.
How It All Works Together: The Workflow
Analytics 2.0 is designed around interconnected workflows. Features don't exist in isolation; they combine to make investigation fast and intuitive. Here's how:
1. Investigating a Traffic Spike
You open Analytics and see an unusual spike in the traffic chart at 2 PM. Click-drag directly over that spike to zoom into that time window.
The entire page updates to that 15-minute period: key metrics recalculate, the Endpoints list re-ranks by activity during that window, and Top Actions shows exactly which Services and domains were involved.
Hover over the top Endpoint and refine. Now you see which Clients on that Endpoint drove the spike, what Filters were triggered, and where the traffic was destined. Three clicks, five seconds, full context.

2. Tracking Down Abnormal Geographic Activity
Your Security Overview shows Home Country Traffic dropped to 82%, lower than usual. Scroll to the Geography map, where you see unexpected volume from a country you don't operate in. Click that country to refine. The traffic chart shows the pattern started three days ago.
The Endpoints list shows it's all coming from one Endpoint. Refine by that Endpoint, and the Clients view reveals a single Client responsible. Check Top Actions to see which domains were queried.
With a full month of query log retention, you can now go back and see if this pattern existed before, or if it's genuinely new.
3. Auditing Long-Term Endpoint Behavior
You want to understand why one Endpoint consistently shows higher block rates than others. Select that Endpoint's Profile from the top bar, choose "Last Month" as your time range, and refine by the Endpoint.
The Endpoints overview immediately shows you its trend: blocked queries are up 127% compared to the previous month. The "Most Active Filter" column shows which category is catching the most queries. Click into Top Actions to see the specific Services and domains being blocked.
With a full month of data, you can differentiate between a recent spike and a sustained pattern, and act accordingly.
Important Notes
Data Availability: Analytics 2.0 has been ingesting data since April 2025. You won't see historical data older than that in the new system. If you need access to analytics data prior to April 2025, please contact our support team.
Documentation Updates: Our knowledge base has been updated with comprehensive Analytics 2.0 documentation, including terminology and feature explanations.
Start Exploring
We’ve packed Analytics 2.0 with features that not only make it easier to access your network data but also improve your ability to analyze, refine, and act on it more efficiently.
Head over to the Statistics page in your Control D Dashboard and dive into the new features of Analytics 2.0 today!